The United States is a bit of a paradox when it comes to money. As one of the richest nations in the world, American households typically have more disposable income than the average country included in the Organisation for Economic Co-operation and Development (OECD) Better Life Index.
But even so, Americans face some of the highest poverty rates among other developed nations as income inequality widens. In the U.S., for example, the top 20% of earners make almost nine times more than the bottom 20%. Meanwhile, Americans work more hours per year than the average nation according to the OECD – ranking 11th out of 39 countries measured for the most work hours.
But how can a country with so much wealth and such hard workers have so much income inequality? To find out, we examined living wage data to calculate the average American family’s financial need based on their location and how much they make hourly. In the process, we uncovered key insights into where it pays to work – where it doesn’t – and how much Americans need to earn to cover the basics.
Putting In Too Much Time
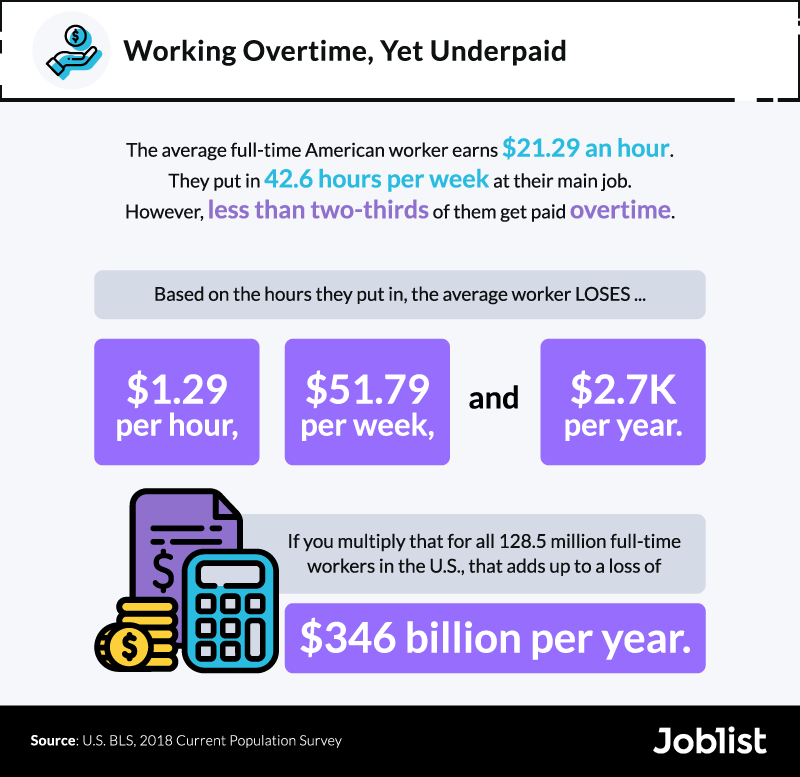
Here’s the hard truth: Many Americans work overtime, but far too few get paid for that extra work. According to our analysis, the average full-time employee works 42.6 hours per week at their primary job, but fewer than two-thirds of this sample gets paid overtime.
Even worse, when their pay is divided by the number of hours they work, the average American worker gets $21.29 an hour. Although that may sound like a lot, it means they’re underpaid by about $1.29 per hour or $2,700 per year.
Given there are approximately 128.5 million adults in the U.S. working full time, that’s a massive amount of money that never gets taken home, circulated throughout the economy, or taxed and diverted to health or education programs. In fact, American workers are shortchanged a total of $346 billion in wages per year.
Missing Out on Time and a Half
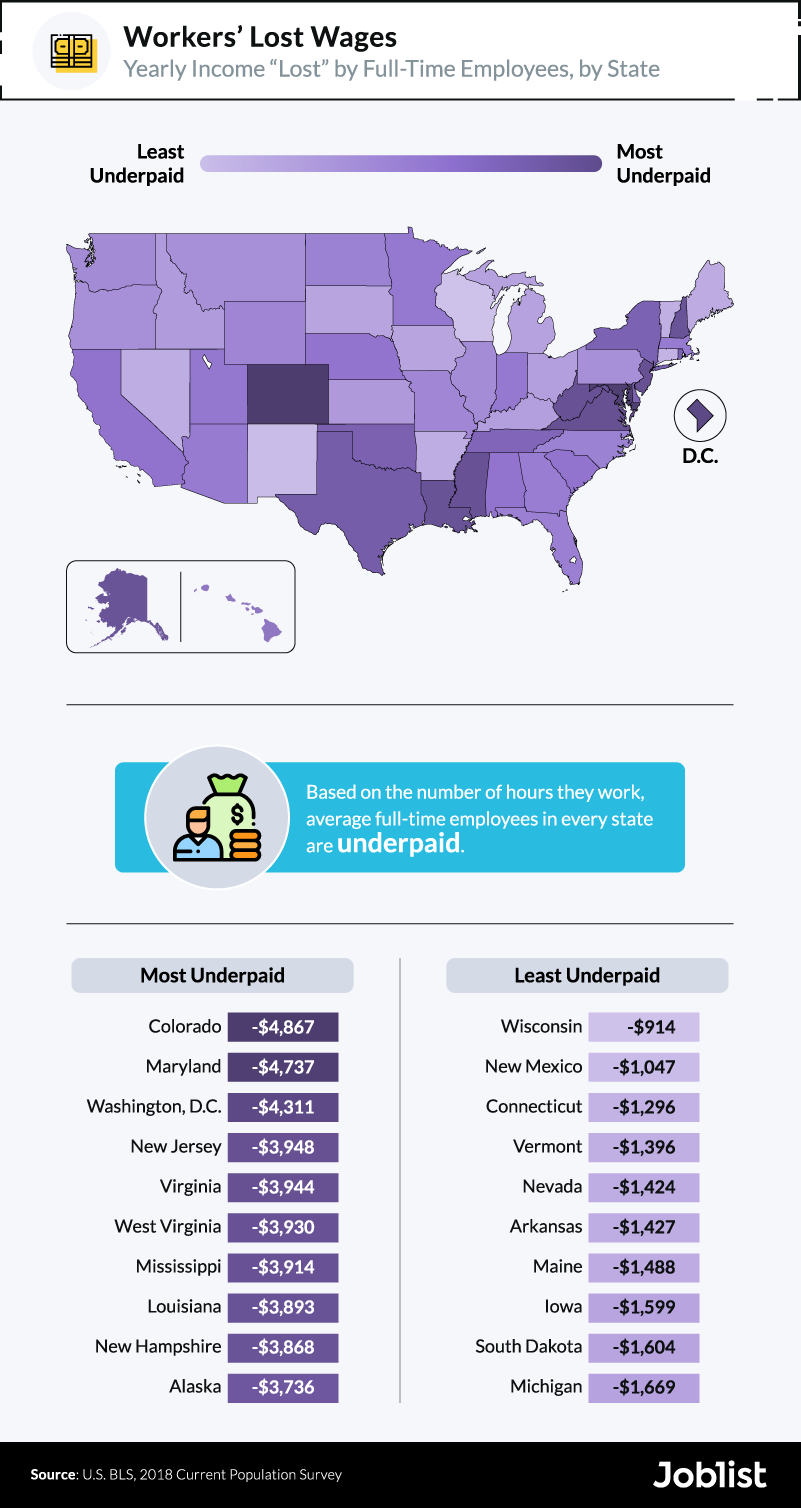
Federal law in the U.S. generally mandates that those who work more than 40 hours each week are entitled to overtime pay unless otherwise specified. However, many Americans still don’t get that extra time and a half – and the amount of money lost really varies depending on the state.
Our analysis suggests that Colorado, Maryland, Washington, D.C., New Jersey, and Virginia are the worst offenders when it comes to missed overtime pay. In Colorado, for instance, the average full-time worker makes around $2.34 per hour less than they should, given the hours they put in. Again, that may not sound like a lot, but it’s about $4,867 lost annually for the average full-time worker.
At the same time, Wisconsin has the least underpaid employees. Still, the average worker loses about $914 in unpaid overtime per year in the Badger State.
Overworked States
Most full-time employees in the U.S. work more than 40 hours per week on average, but which states clock in the most overtime – and how many employees get paid for that extra labor? This sortable table allows you to see every state's average hours worked, the percent that work multiple jobs and the percent who work 41+ hours and are paid for that overtime.
Workers in Wyoming put in the most hours, averaging 45 hours per week at their main job. However, about 45% of these workers are paid for their overtime, which is a relatively high rate compared to other regions. In Washington, D.C., for example, workers put in the fourth-highest number of weekly hours, but only 4.4% are compensated for overtime.
The number of people who willingly work overtime for no additional pay could reflect a growing “hustle culture” among young professionals, in which some devote the entirety of their time and life to work. As peers and friends broadcast their pursuits and sacrifices on social media, others may feel they aren’t doing enough to keep up. This social pressure can lead to hours of additional free work and, eventually, major burnout.
The Current Population Survey also revealed that some full-time workers hold multiple jobs. Alaska and North Dakota had some of the highest rates of full-time workers with multiple jobs (around 7% to 8%), yet both states have relatively high overtime pay rates of approximately 35% to 43%. Workers in Alaska may be more likely than others to take second jobs because of the expense of living in Alaska. It’s the 7th most expensive state in the nation to live in, and it has one of the highest rates of underemployment among workers, which would lead some to seek multiple jobs.
Across the country, about 4.4% of full-time workers have more than one job, but some say there may be even more Americans in this situation.
Where Earnings Aren’t Enough
Many Americans struggle to pay for their basic living expenses every month. About 12.3% of the country was under the national poverty line in 2017, according to the U.S. Census Bureau. Those living in 4-person households with a combined annual income under $24,600 were considered to be living below the poverty threshold. However, some states may feel the squeeze a little more than others – especially those with abnormally high costs of living.
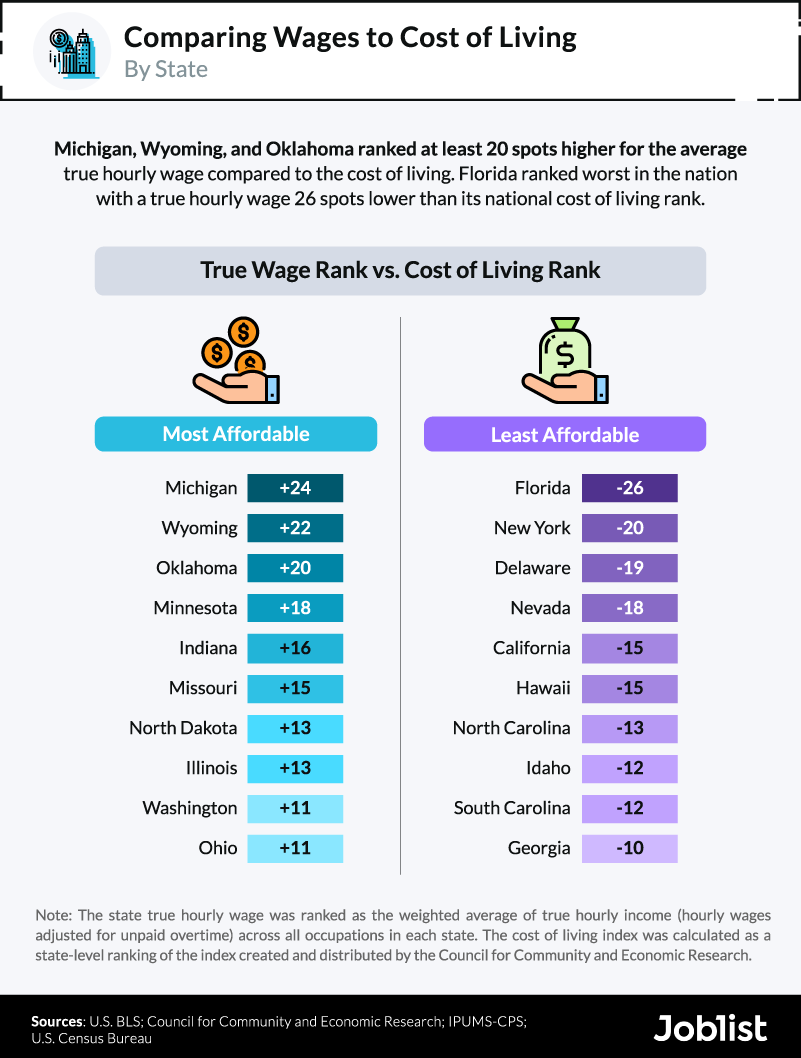
We examined the cost of living in each state versus the average hourly wage to learn where Americans make wages that are better (or worse) than the average cost of living. Our results suggest that many states in the Midwestern and Southern regions of the U.S. have wages that are worse than the average cost of living, such as Tennessee, Montana, West Virginia, Texas, Georgia, and Idaho.
When further comparing wages to the cost of living, Florida, New York, and Delaware are the least affordable states.
But when it comes to states where residents get the best bang for their buck, places like Minnesota, Michigan, Wyoming, Oklahoma, Indiana, North Dakota, and Illinois stand out. In these regions, the gap between the average cost of living and true hourly wage is noticeably larger. This means that families are more likely to pocket some savings. Overall, Michigan, Wyoming, and Oklahoma are the most affordable states.
True Power of Your Wages
The cost of living varies from state to state. Wages also have varying purchasing power nationwide, too.
If you’ve ever thought about moving to another state for better pay, don’t only consider salary. You should also weigh the value of earnings based on your working location. Fortunately, the U.S. Bureau of Labor Statistics calculates this value for a variety of occupations and areas.
To explore this map and other occupations, click here.
The cost of living varies from state to state. Wages also have varying purchasing power nationwide, too.
If you’ve ever thought about moving to another state for better pay, don’t only consider salary. You should also weigh the value of earnings based on your working location. Fortunately, the U.S. Bureau of Labor Statistics calculates this value for a variety of occupations and areas.
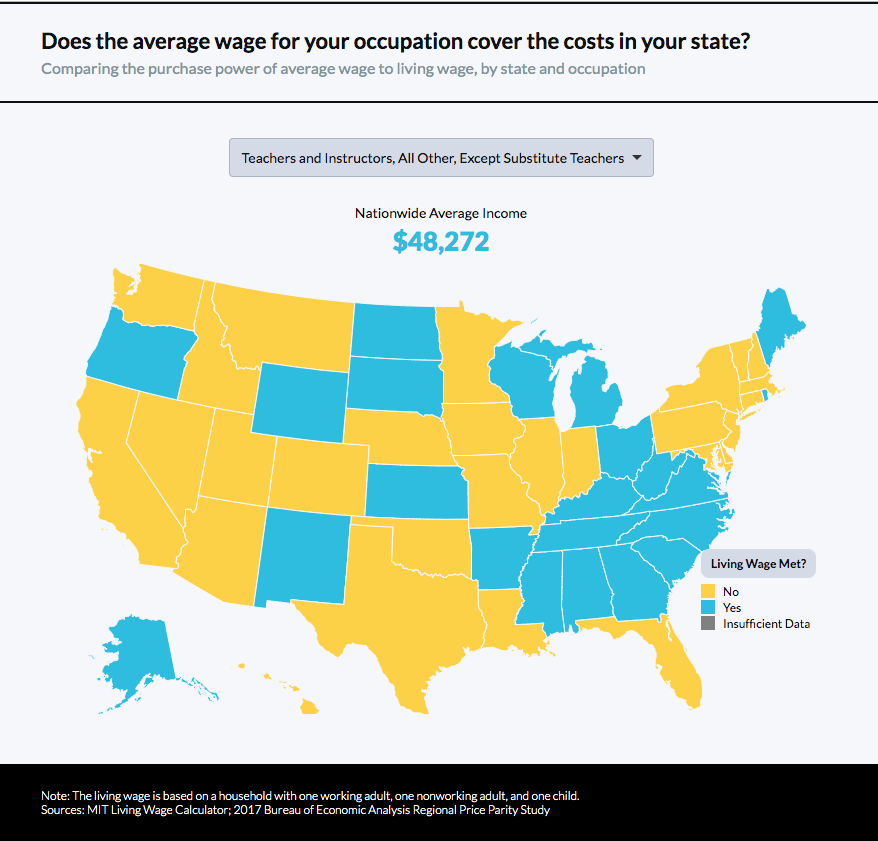
We found that earnings for some occupations were “powerful” enough to cover basic costs nationwide, and others were highly dependent on the location. For instance, teachers and instructors, as illustrated above, only earned enough to exceed the living wage in certain states. The purchasing power of the average income for other occupations exceeded the living wage in most states. These occupations included:
To see how the purchasing power of your job’s income stacks up to the living wage for an average American family, explore our interactive map above.
Conclusion
Conventional wisdom tells us to do what we love when it comes to work, but what happens when your work doesn’t love you? Our analysis of average overtime, wages, and the cost of living around the U.S. paints an in-depth picture of the American workforce. A large portion of Americans – more than a third – still don’t get paid for overtime, despite the average full-time worker putting in more than 40 hours each week.
This information can help job seekers figure out their next step and ensure they’re getting paid fairly for their work. It can be as simple as finding a similar job in a new location. To search for a job opportunity that best fits you, visit Joblist.com for personalized results and a database with millions of offers around the country.
Living wage data was collected from MIT’s Living Wage Calculator, which – on a county-by-county basis – calculates the basic needs of a family ranging from one to two adults and from zero to three children, with one or both parents working full time or, as a unique dataset, with one adult working part time. Basic needs include:
Food
Child care
Health
Housing
Transportation
Other necessities
Taxes
Calculation sources were taken from Living Wage Calculator: User’s Guide/Technical Notes, 2018 Update, by Carey Anne Nadeau, Open Data Nation.
The state hourly true wage was ranked as the weighted average of the true hourly income (hourly wages adjusted for unpaid overtime) across all occupations in each state. The cost of living index is calculated as a state-level ranking of the index created and distributed by the Council for Community and Economic Research.
Other data were collected from the Integrated Public Use Microdata Series on the Current Population Survey (IPUMS-CPS) for 2018. The Current Population Survey is administered jointly by the U.S. Census Bureau and the Bureau of Labor Statistics. IPUMS-CPS allows for the management of all of the variables and analysis on an individual level – in short, it’s microdata. The data we used are from a sampling of 88,800 respondents, using survey samples from each month in 2018. We filtered out respondents who left any of three specific questions on the Current Population Survey (CPS) blank: the survey question asking for weekly earnings (EARNWEEK), the question asking for hourly wage (HOURWAGE), and/or the question asking for hours worked (UHRSWORK1; UHRSWORKT). We also filtered out those who responded to the hours worked question(s) with the response “hours vary.”
Our sample size of 88,800 people is the result of this filtering. The variables we used from IPUMS-CPS included the following: survey year; household serial number; month; household weight, Basic Monthly; CPSID, household record; flag for ASEC, state (FIPS code); metropolitan area; person number in sample unit; final basic weight; CPSID, person record; occupation; hours usually worked per week at all jobs; hours usually worked per week at main job; hours usually worked per week, other jobs; earnings weight; hourly wage; and weekly earnings. We found lost wages by comparing the reported hourly wage to annual salary divided by actual hours worked. We multiplied that number by 40 to find wages lost in a week and multiplied the average hourly wages lost by 40*52 to find wages lost in a year.
Purchasing power is defined as the mean wage for an area/occupation divided by its regional price parity and multiplied by 100. Wage estimates and the RPP estimates are subject to error, so the purchasing power estimates are subject to error as well. Please visit BEA.gov for the full methodology.
Regional price parities are also available online at the Bureau of Economic Analysis website. Not all areas that have OES data have an exact regional price area.
Fair Use Statement
Have a friend or family member who might be interested in this content – or interested in switching jobs? We encourage you to share this page for all noncommercial purposes, as long as you link back to the page to give the authors credit.
Joblist uses cookies as well as our third-party affiliates. When you use our website, you understand that we collect personal data to improve your experience.