Throughout United States history, minority, ethnic, gender, and religious groups have been impacted heavily by wage and income gaps — an issue still prevalent today. When someone fits into several disenfranchised groups, which is commonly the case for women of color, they often earn a fraction of the dollar in comparison with their white male counterparts.
Discussions today surrounding economic inequalities don’t just focus on gender, though. Instead, looking across industries, regions, and age groups to find which workers are most at risk for wage inequality.
Using the Bureau of Labor Statistics’ Occupational Employment Statistics data, we explored the various industries, sectors, occupations, and geographies with the largest spread in salary. Additionally, we created an interactive tool that allows you to look up any occupation to see how it ranks overall based on wage gaps. Which occupations have the largest disparity in pay? What is the largest difference between the top and bottom earners with a certain occupation? Which cities and states can we expect to see the largest ranges among pay?
Explore our custom tool below and keep reading to learn more about the different types of wage gaps in the United States.
Average Salaries Nationwide
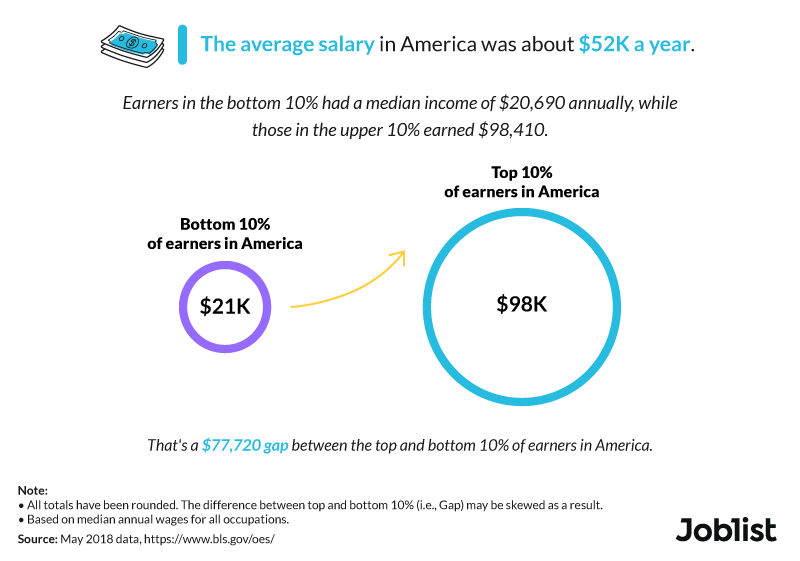
The annual mean wage for Americans is just under $52,000 per year. When comparing the top and bottom 10% of earners, we discovered a $77,720 gap in median annual income.
As you continue through the data, you’ll see fluctuations in this gap according to city, state, occupation, industry, gender, and more. This data speaks to the immense range in salaries in the United States, regardless of how difficult or intensive a job can be.
Salary Disparities by State
The nation’s capital was home to the widest gap between the highest and lowest income earners, with a gap of $136,000. In comparison, New York had a $97,000 difference in median annual income. The poverty rate in Washington, D.C. hovers over 16%, veering even higher for children under the age of 18 (23%), all while the district boasts the highest salary among the top 10% of earners at $164,200.
Meanwhile, residents in South Dakota experienced the smallest wage gap in the nation at $50,000. The top earners in the state earned over $70,000, speaking to low relative wages and high percentages of the population dependent on financial assistance.
Across the board, lower incomes tended to stay within a range of $18,000 to $26,000, with most bottom 10% earners making around $20,000 annually. On the other end of the spectrum, higher incomes ranged from $103,000 in Atlanta and Houston to over $160,000 in San Jose.
Although metropolitan areas toward the bottom of the list had less significant gaps between the top and bottom 10% earners, many of these cities still struggle with income inequality, including Houston, Chicago, and Atlanta.
Industries and Wage Gaps
Workers in the legal field can be lawyers, paralegals, legal assistants, arbitrators, and more. The industry is poised to grow by 7% in the next decade as a result of increased demand for legal services and the streamlining of legal professions. The top 10% of workers in this industry earned over $208,000 per year, equating to a nearly $171,000 gap between the bottom and top 10% of workers in the field.
Beyond that, industries related to tech, science, and mathematics had higher-than-average earnings for the top 10% of workers. One thing to note here is that occupations can span multiple industries, such as is the case with any type of manager. Those positions are unique to their respective fields and also count as management occupations.
Toward the bottom of the list were food preparation jobs, which had a $20,000 gap between the lowest and highest earners, an indication of low advancement opportunities in the industry. Although the industry is growing faster than the average field, high competition among food prep workers can make it difficult to secure full-time jobs, making upward mobility that much harder.
Highest Paid Industries by Occupation
Are you in an industry that pays more toward the top of the scale or the bottom? Select an occupation group, and our interactive tool will tell you which industries have the highest median salaries for each occupation. If you’re looking for a new job or wondering about other industries and their income potential, indulge your curiosity using the tool below.
Click here to see median occupational salaries by industry.
Gender, Pay, and Progress
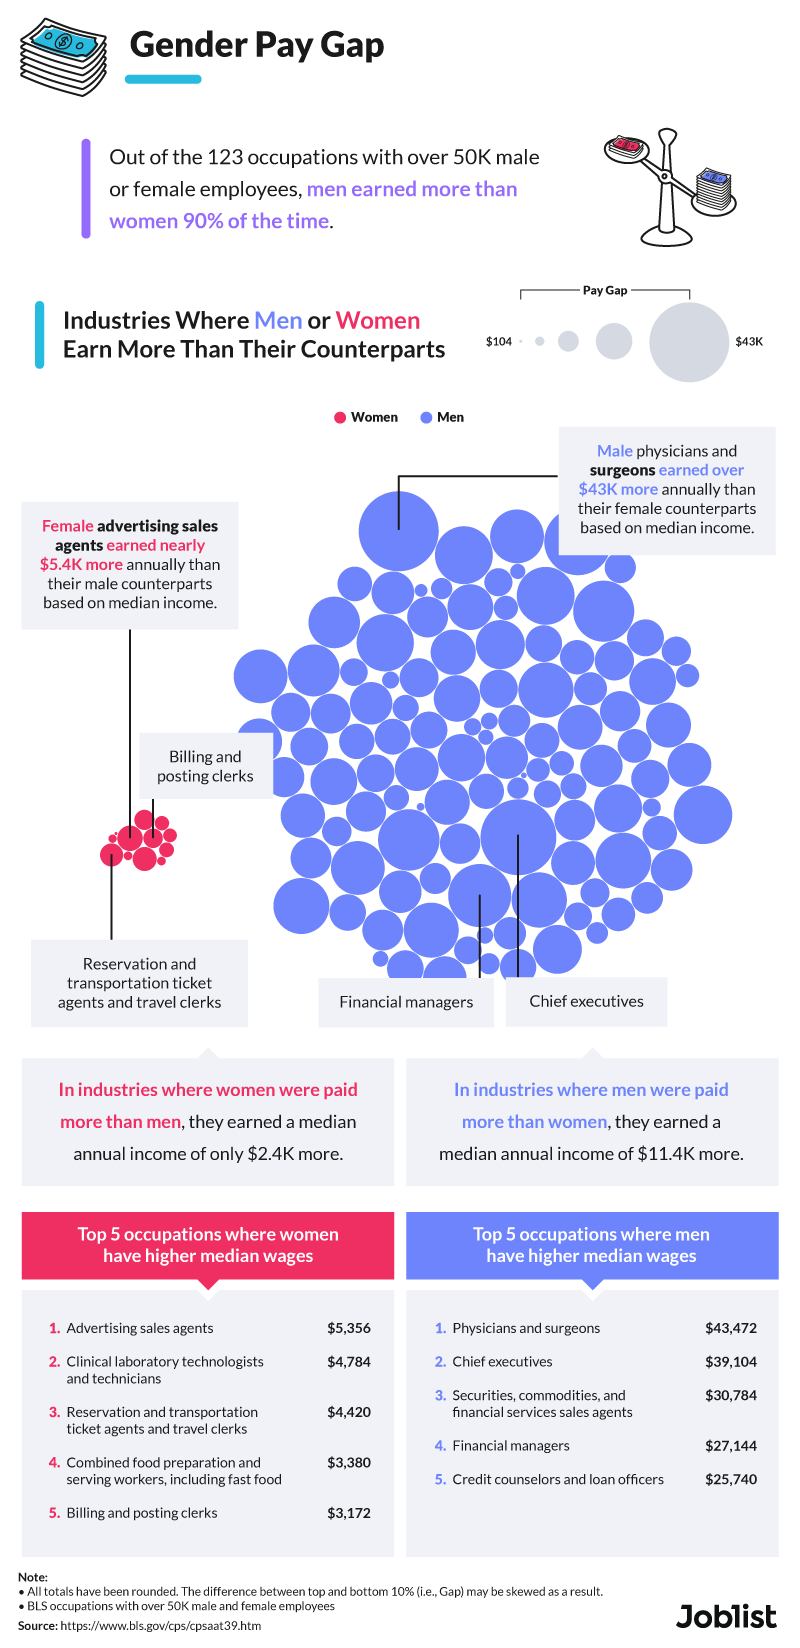
While the U.S. has made progress in terms of recognizing and attempting to eliminate the gender pay gap, residents are still experiencing the effects of decades of inequality. Out of the 123 occupations analyzed, men had a higher median income than women in 90% of the occupations with over 50,000 male and female employees.
Women fared better than average in a small selection of occupations, prominently in occupations like advertising sales agents, clinical lab techs, transportation and reservation ticket agents, and clerks. However, even in these roles, they only made an average of $2,400 more than their male counterparts, capping out at $5,356 more in advertising sales agency roles.
On the other hand, in the 90% of the industries where men had a salary advantage, men earned a median annual income that was $11,400 more than women doing the same job. For fields with the widest income gap, such as for chief executives, physicians, and surgeons, men earned over $39,000 and $43,000 more, respectively. Disparities like this don’t only involve salary but also bonuses, 401(k)s, and other benefits.
Closing These Gaps and Finding Solutions
Putting an end to pay inequalities is easier said than done, but progress is happening. Pressure falls on business owners to value hard work when considering promotions and to fairly distribute pay based on experience, not gender.
Did our interactive tool reveal a deep-seated interest in a new field? Curious about what’s out there? Looking for a change? Head over to Joblist to explore millions of top job postings geared specifically to your interests and career goals. Be sure to turn on notifications for customized job listings sent right to your inbox. Don’t settle for an occupation that may put you at a disadvantage. Discover a new future with Joblist.
Methodology
We tapped into the Bureau of Labor Statistics’ (BLS) most recent Occupational Employment Statistics (OES) report on employment and wages for over 800 occupations available per state or nationwide. The May 2018 OES data was released on March 29, 2019, and is available here. Occupation groups were defined by the BLS, including an “all occupations” group.
To determine the wage gap between the top and bottom earners per occupation, we calculated the difference between the annual 10th and 90th percentile wage (the median wage of the top and bottom 10% of earners). Throughout this project we refer to those earners as the “Top 10%” and “Bottom 10%” of earners.
In some cases, a wage estimate was not available for a specific wage percentile. In these circumstances, the next available percentile was used to calculate the difference between the top and bottom earners. Additionally, some percentile wages were listed with a “#” sign. This indicates a wage equal to or greater than $208,000 per year. In these cases, $208,000 was used as the upper wage percentile. Although rare, this may present problems when viewing specific occupations by specific industry, as the mean wage may actually be more than the upper wage percentile.
When displaying occupation groups by mean annual wages, occupations with under 5,000 employees were excluded. “Cross industry” filters were applied for industry groups. Suboccupation groups labeled as “miscellaneous” or “other” were removed.
When looking into wages by gender, we used the BLS’s most recent Current Population Survey (CPS) found here. Specifically, we tapped into the “Median weekly earnings of full-time wage and salary workers by detailed occupation and sex” table where we looked at the differences in wages for men and women per occupation. Median weekly earnings were reported for men and women where there were more than 50,000 employed men and 50,000 employed women in each occupation. Again, occupation groups were defined by the BLS. There were over 400 occupations where either men or women did not meet the 50,000 employed sample size for a median wage to accurately be calculated by the BLS.
Fair Use Statement
Play around with our wage estimate calculator and see what your talents can earn you elsewhere. Send our interactive tool to your friends to learn how they fare in their current occupations. Be sure to cite us when sharing our data, and only spread this information for noncommercial purposes.
Joblist uses cookies as well as our third-party affiliates. When you use our website, you understand that we collect personal data to improve your experience.